of High-Performing Truckload Carriers
Chris Henry · President · KSM Transport Advisors
What separates the carriers who thrive from those who merely survive? After analyzing hundreds of truckload operations, we've identified 12 common traits.
If a team member thinks you're making 62% net margins, do you think they're really contemplating the cost impact of their day-to-day decisions?
Effective delegation frees management for strategic initiatives — working on the business instead of in it
Empowering employees drives engagement, accountability, and innovation from the ground up
Clear communication and training are essential — delegation without support is abandonment
Empowerment balanced with performance metrics creates confident, effective decision-makers
To price freight, you need to know your costs — all of them — if you want to be profitable.
Think like an actuary, not a salesperson.
Less 'finger-pointing' between sales and operations. Everyone works from the same pricing foundation, with a clear understanding of cost and margin targets.
Click to learn about a new precision pricing tool
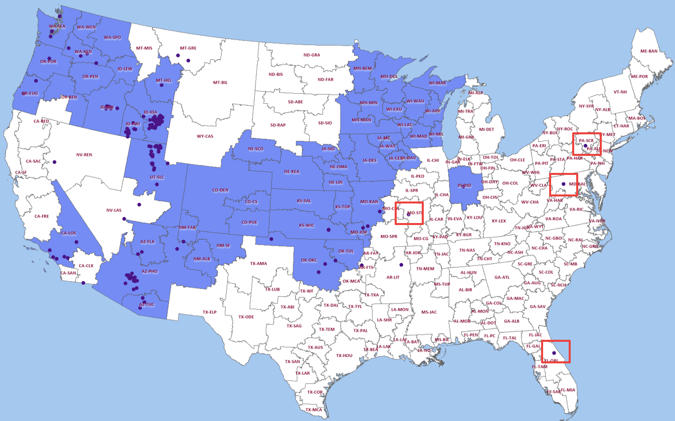
Precision RFP Pricing for the Masses
A new tool from Nussbaum Technology bringing data-driven, centralized RFP pricing to truckload carriers of every size.
More loads in fewer markets = less deadhead, better utilization
Higher utilization = faster turns, more revenue per truck per week
Network density is the multiplier — rate per mile alone won't tell you the story
Most freight dense lanes. Top 25% by load count. Do more here.
Least freight dense lanes. Bottom 25%. Begin to cut.
Define Your Network and Stick With It!
Eastern WA → MO. 124 mi DH. 1,908 LOH @ $2.40 all-in. Margin: $210. Transit: 5d 7h.
DH 50 mi home. Sits 7 days. DH 315 mi to KS → Amarillo. 545 LOH. Margin: $332. Transit: 2d 7h.
72% of bottom-quartile yield drivers lived outside the network. Out-of-network drivers reduce velocity and dilute the footprint.
One company's backhaul is another company's headhaul (unless you're based in Florida). Think network value, not one-way profitability.
Proper use of brokers allows carriers to efficiently connect good market areas to other good market areas. Can't just evaluate on RPM.
A load that looks marginal on a one-way basis may be highly profitable when you measure its full network contribution via FreightMath OR.
Data Sanity > Data Vanity
Stop saying "I have to keep my drivers moving." A smaller, more profitable fleet beats a larger money-losing one every time.
The Deepest Hole in Trucking
Invest in safety culture, technology, and training. The ROI is measurable in lower insurance premiums, fewer claims, and sustained profitability.
Understand their importance to the community. Foster continuous learning. Build lasting relationships.
Open communication drives innovative problem-solving and cross-functional partnerships.
Approachable leadership improves morale. Inclusive decision-making leads to better strategies.
They've been through down-cycles. They prioritize sustainability and long-term viability.
Model dedicated contract rates with real cost inputs — driver pay, fuel, insurance, maintenance, and margin targets. Free to use, no sign-up required.
Launch Calculator →30-Day Complimentary FreightMath Trial
Available for McLeod, TMW Suite, Alvys, OpenRoad & 10Speed TMS users.